OsmAnd tracks
July 2021
About the project
- Build a pipeline to visualize track information from OpenStreetMap for Android (OsmAnd)
- Waypoints are collected by the track recording plugin for OsmAnd
Visualize tracks using OpenLayers
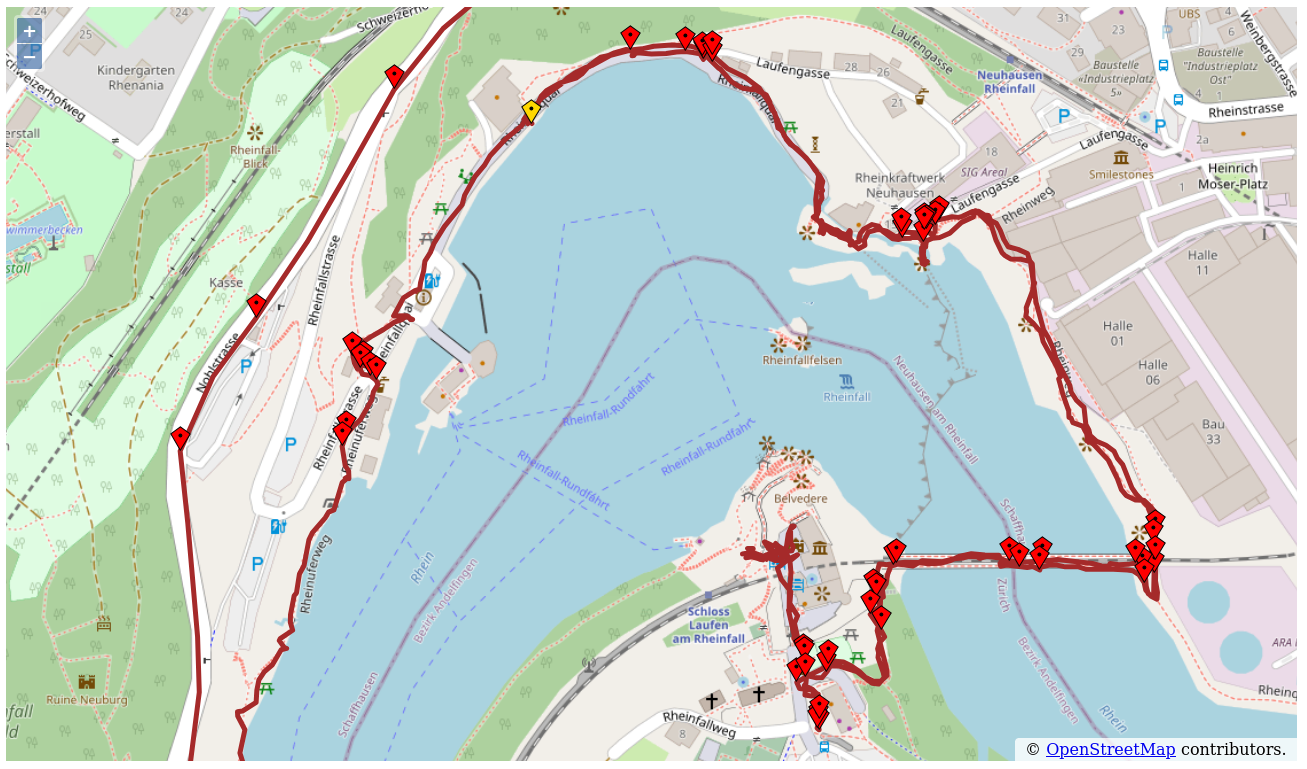
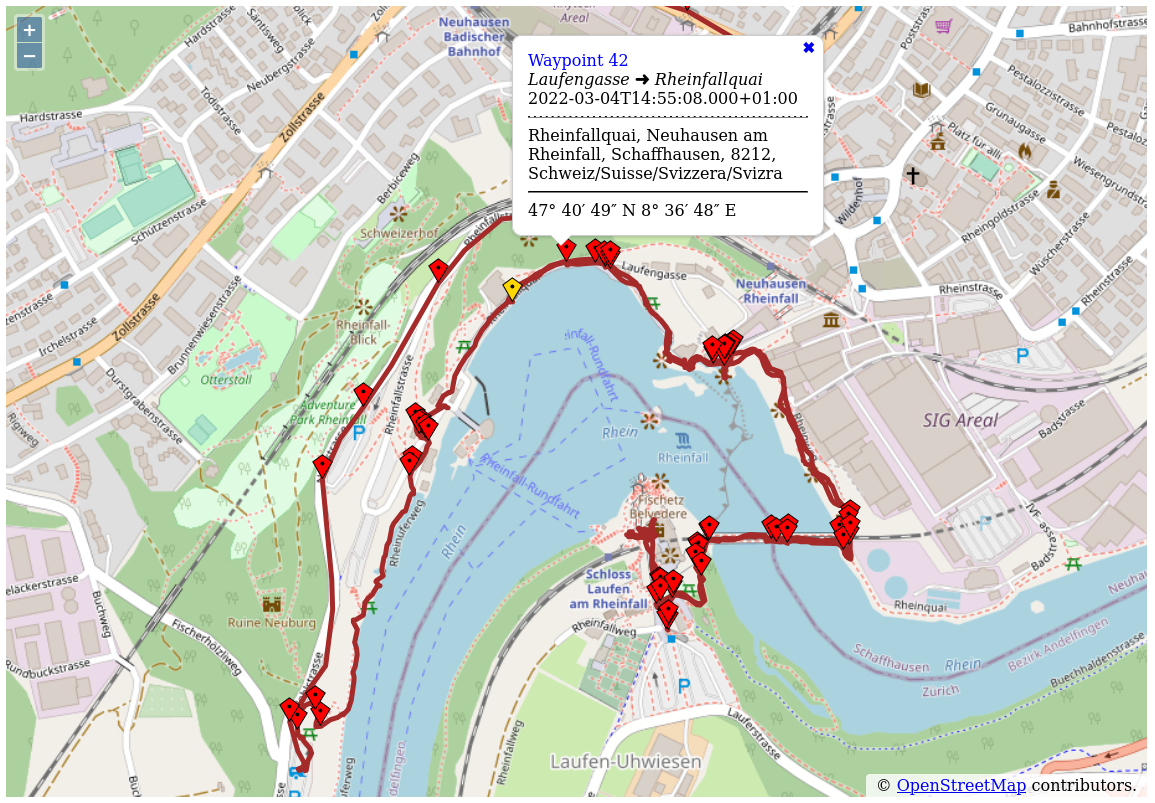
- Show track on maps from OpenStreetMap
- Show waypoints where the street changes
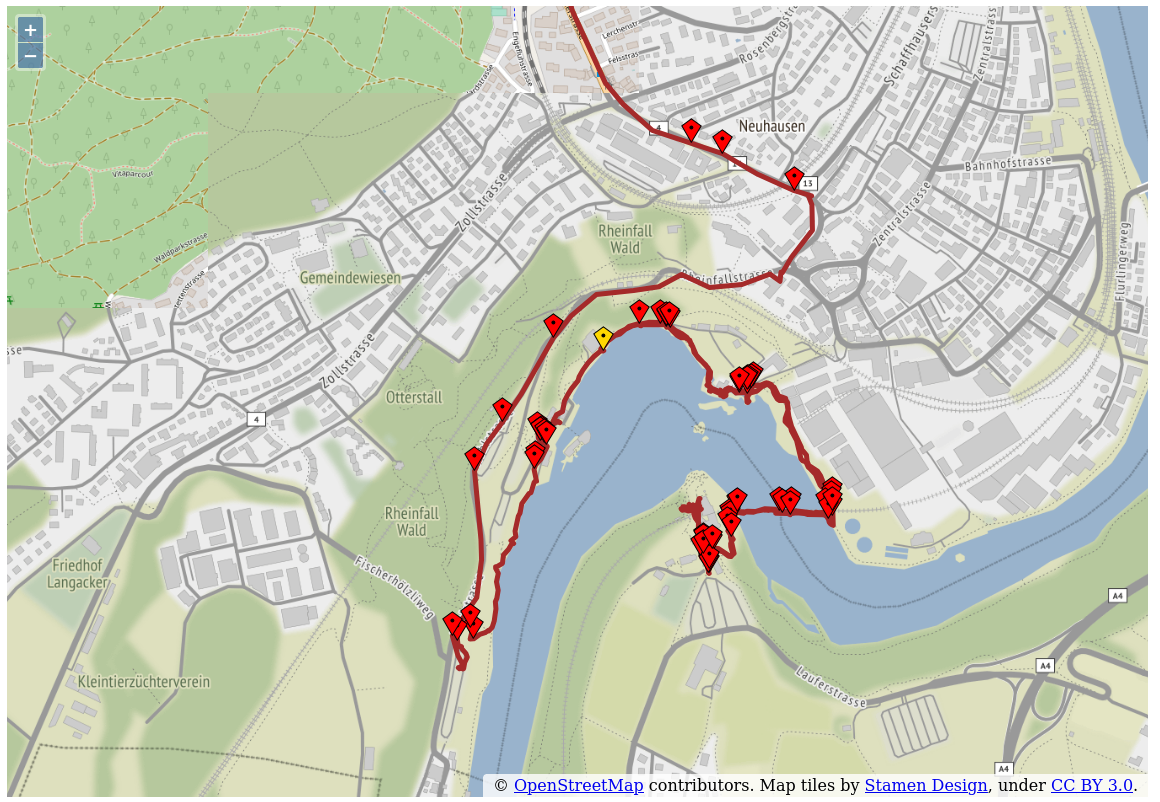
- Show track on Stamen maps
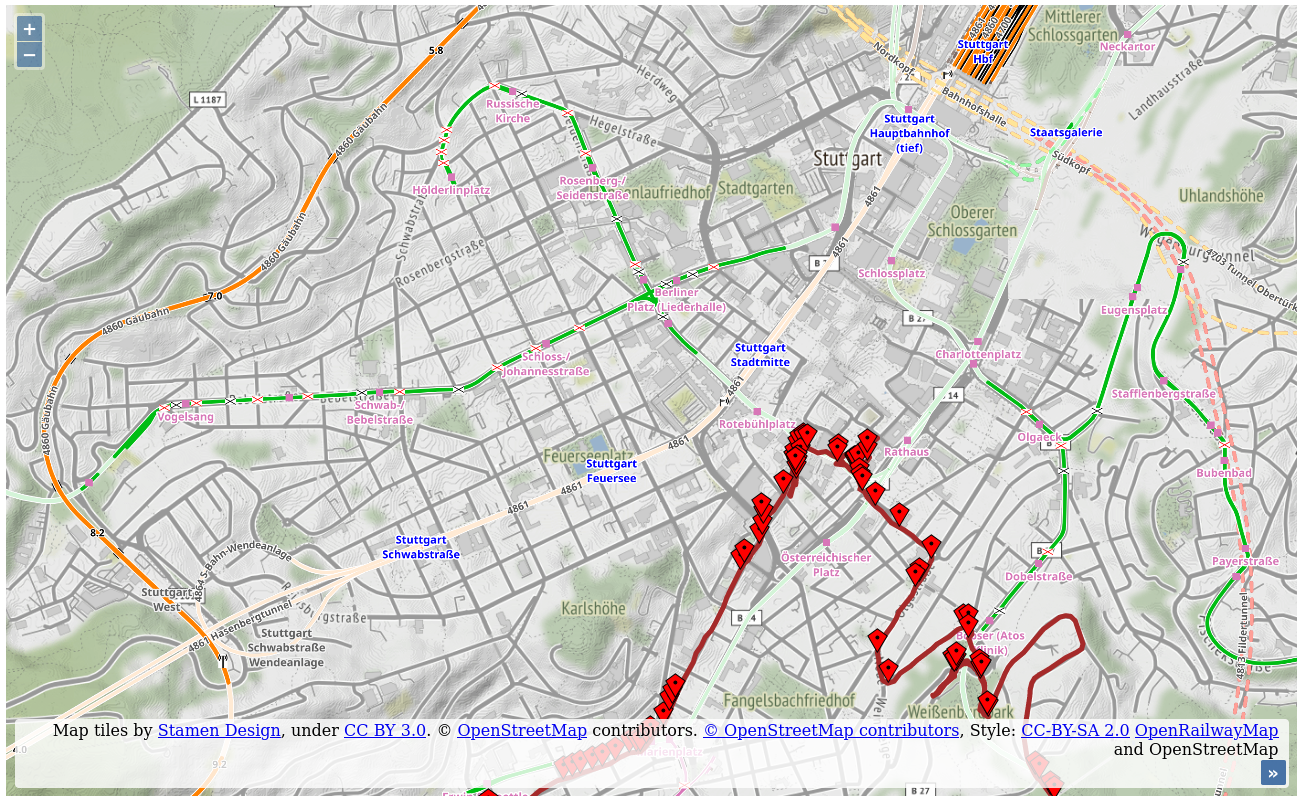
- Enrich maps by adding an overlay provided by OpenRailwayMap to show railway information
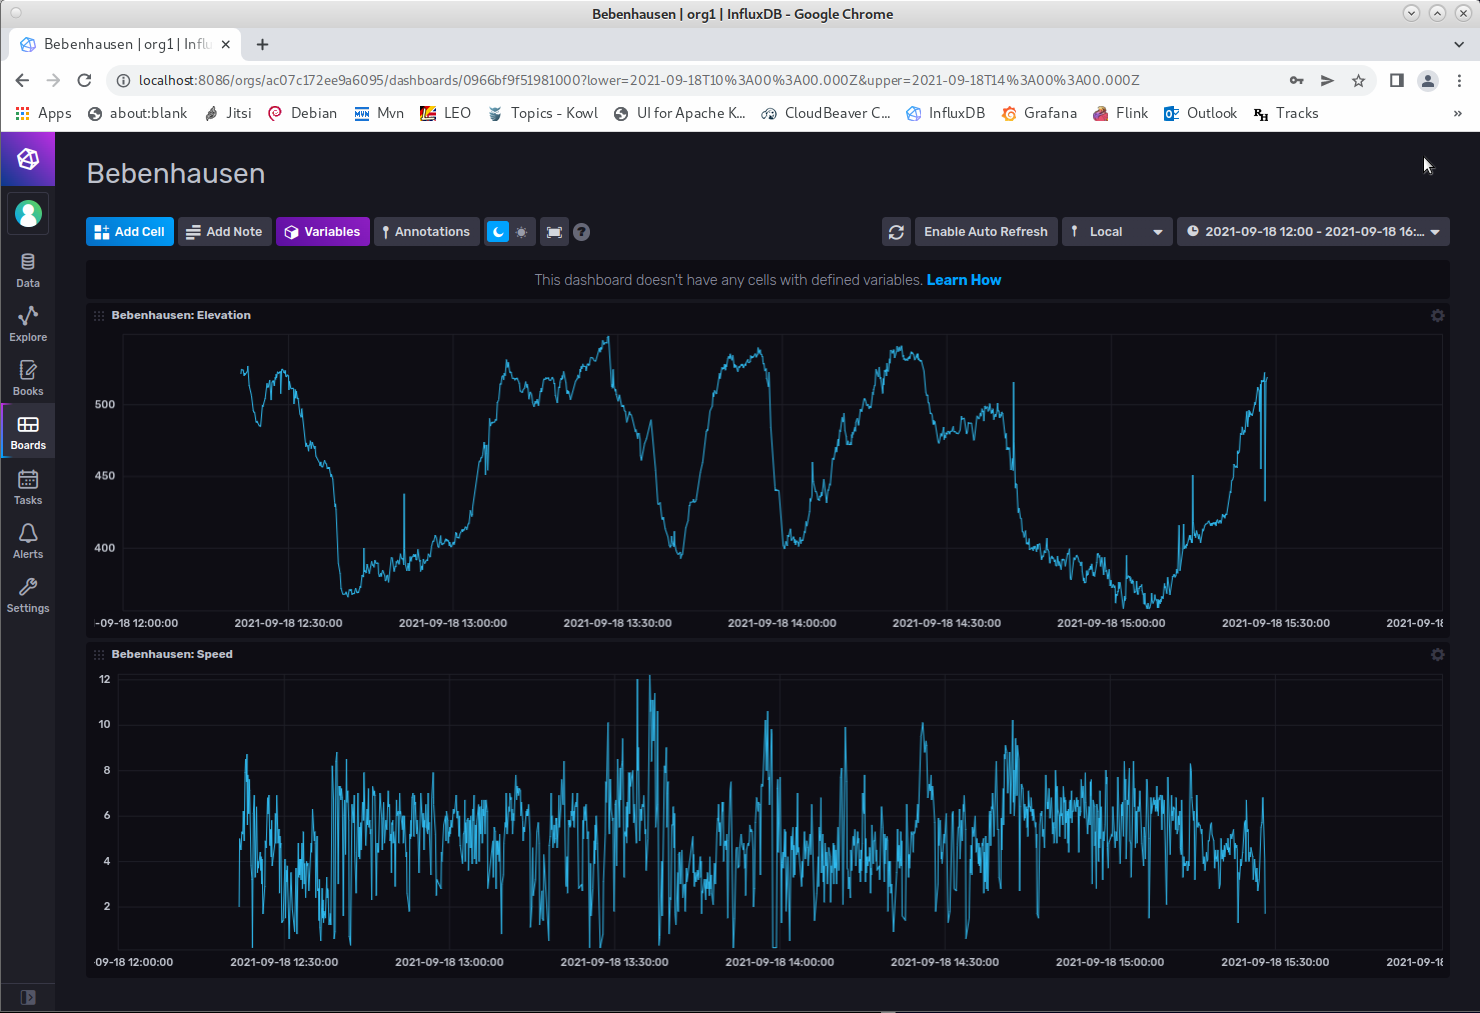
Visualize values using InfluxDB
- Dashboard to visualize speed and elevation
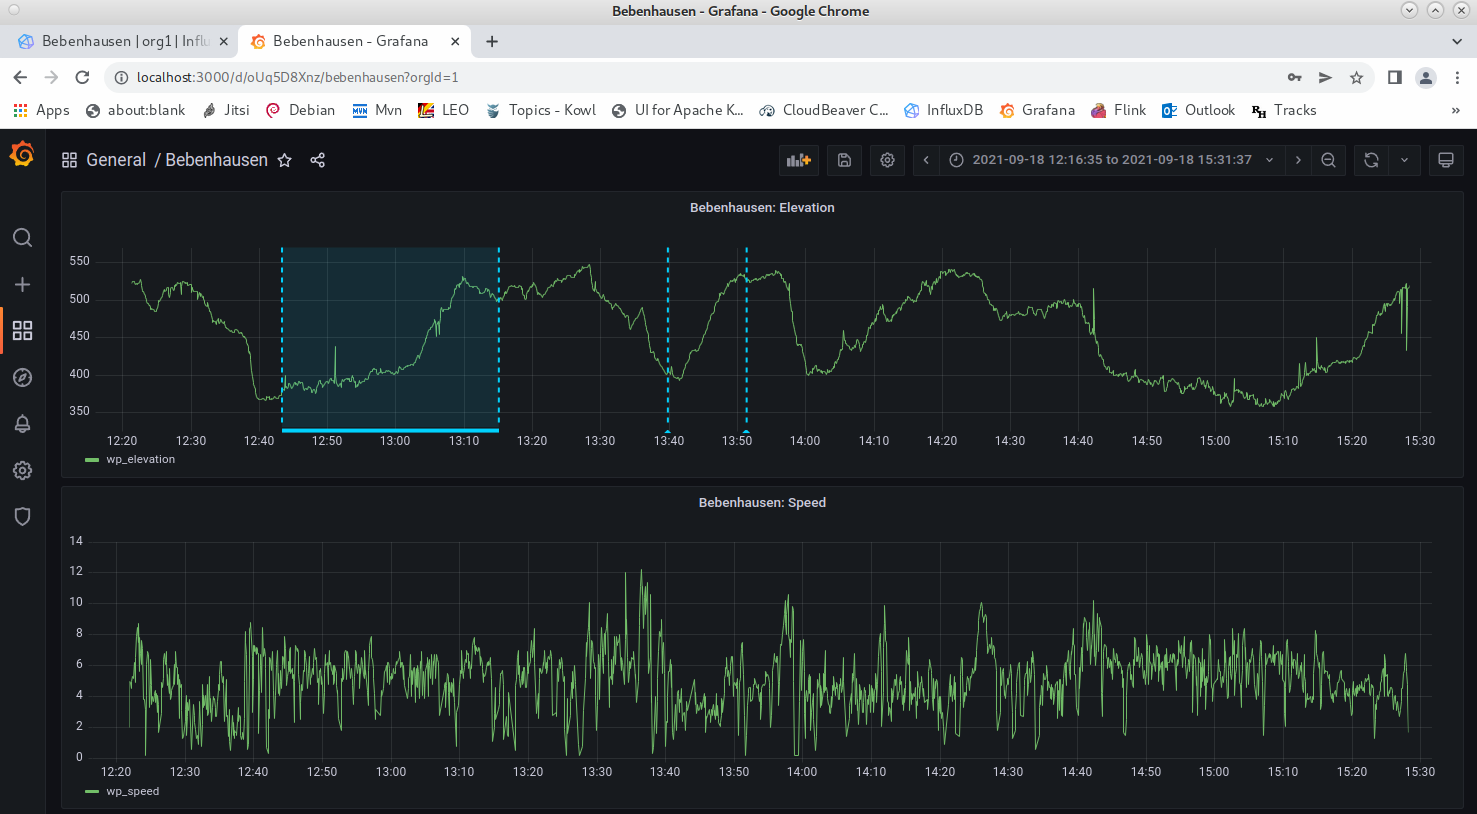
Visualize values using Grafana
- Grafana dashboard to visualize speed and elevation
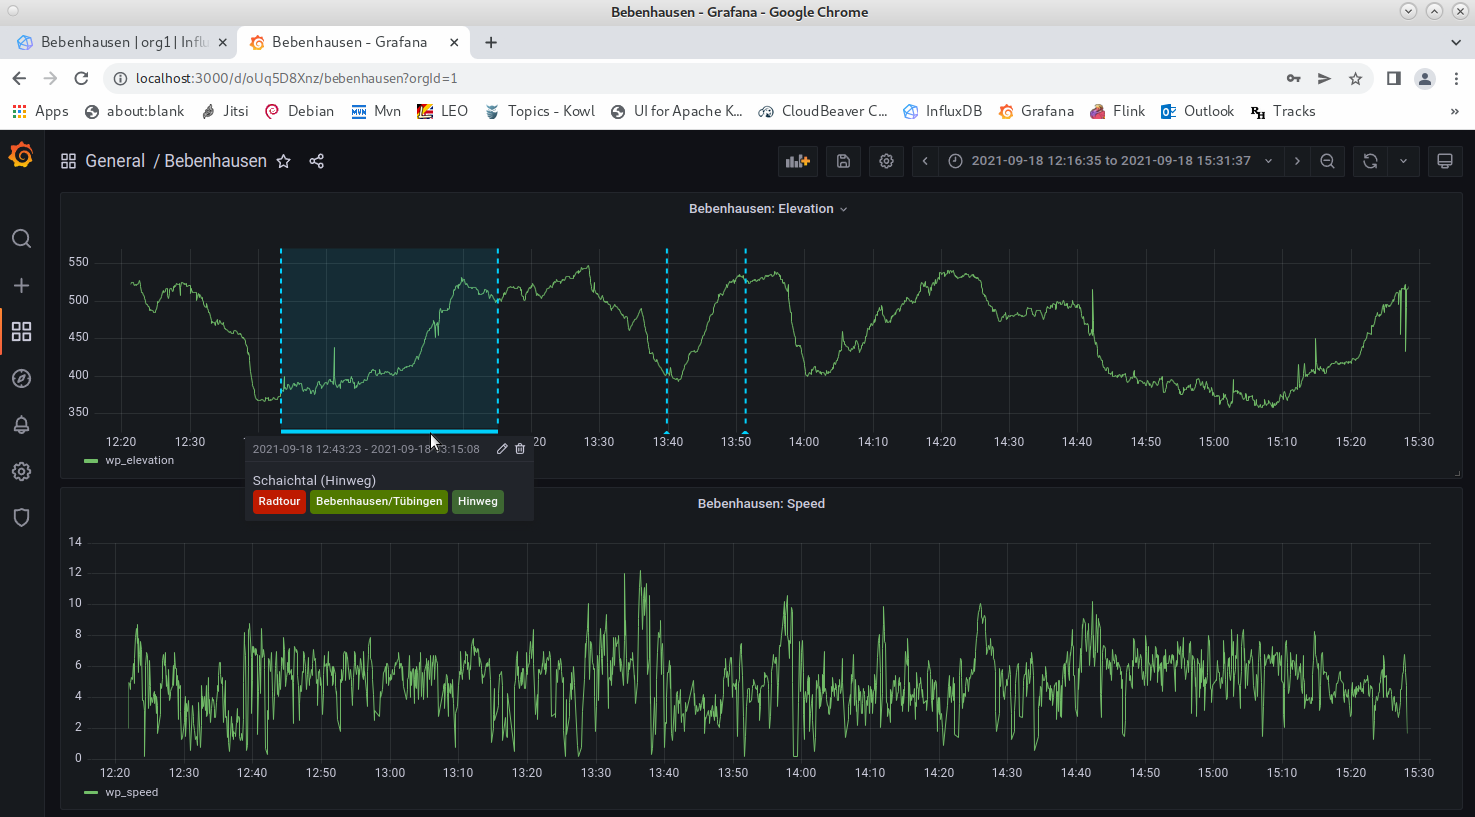
- Use annotations to mark special sections and waypoints
- Section annotation details
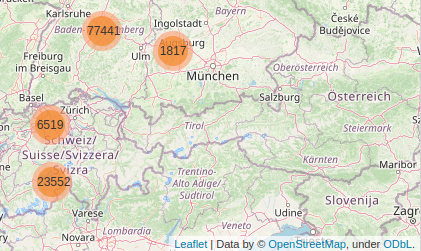
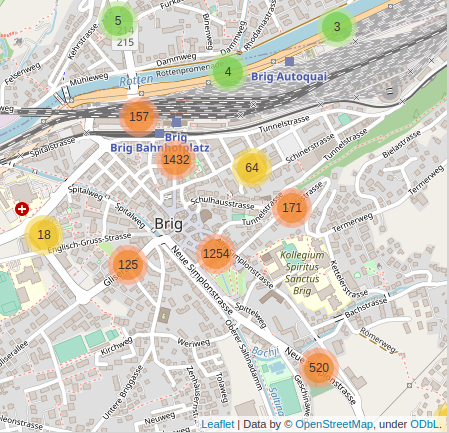
Visualize waypoint clusters using Folium/Leaflet
Project details
-
The track recording plugin records waypoints into GPX files
-
Extract data from GPX files using Spark and Spark XML
- Enrich data by using OpenStreetMap lookups to extend waypoint information
- Store transformed data as JSON for OpenLayers visualization
- Store transformed data as JSON for InfluxDB import
-
Visualize tracks using in a web application using JavaScript and OpenLayers
- Show tracks on maps from OpenStreetMap
- Show waypoints where the street changes
- Show tracks on Stamen maps
- Using overlay maps from OpenRailwayMap to add public transport information
-
Load track information into InfluxDB for analysis
- Analyze speed and elevation
- Visualize information using InfluxDB web UI
- Visualize information using Grafana
- Use Grafana HTTP API to create annotations
-
Visualize cluster information on maps using Folium/Leaflet
- Visualize track waypoint clusters
Roles
- System Architect, Data Architect, Data Engineer
- Design, development, integration, test
References
- OpenStreetMap
- OpenStreetMap for Android (OsmAnd)
- OsmAnd trip recording plugin (Streckenaufzeichnung)
- GPX format
- Stamen maps
- OpenRailwayMap
